Loading...
This comparison has not been analyzed yet.
One-time AI generation (~1 minute). Scores and timeline are already available below.
Masayoshi Ohira vs Yoshihiko Noda
Masayoshi Ohira leads by 12.9 pts · 2 figures compared
…
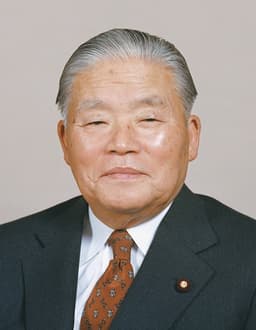
Masayoshi Ohira
Politician · Modern
49.8Total

Yoshihiko Noda
Politician · Modern
36.9Total
Basic Information
Born
1910
1957
Died
1980
—
Era
Modern
Modern
Nationality
Japan
Japan
Occupation
Politician
Politician
Civilization
Eastern
Eastern
Score Comparison
Military (10%)
14.6
16.1
Political (20%)
59.3
32.2
Influence (20%)
56.4
48.6
Legacy (20%)
45.0
37.5
Leadership (15%)
72.0
41.5
Strategy (15%)
33.1
26.9
TOTAL
49.8
36.9
Masayoshi Ohira — Complete Timeline
1978 AD
Appointed Prime Minister of JapanPolitical Action◆ Major
Masayoshi Ohira became Prime Minister of Japan on December 7, 1978, succeeding Takeo Fukuda. His election followed a close LDP presidential race. Ohira's government focused on economic management and foreign policy, including strengthening ties with the United States.
Prime MinisterLDPJapan
Impact: national
1979 AD
Hosted the 5th G7 Summit in TokyoPolitical Action◆ Major
Ohira hosted the 5th G7 Summit in Tokyo from June 28-29, 1979. The summit addressed the global oil crisis, inflation, and energy policy. Ohira played a key role in coordinating Western responses to the second oil shock following the Iranian Revolution.
G7 SummitDiplomacyOil Crisis
Impact: global
1980 AD
Died in OfficeOther◆ Major
Ohira died of a heart attack on June 12, 1980, while in office as Prime Minister. His death occurred during a general election campaign, triggering a sympathy vote that led to a landslide victory for the LDP. He was the first Japanese prime minister to die in office since 1945.
Death in OfficeLDPJapan
Impact: nationaltragic
Yoshihiko Noda — Complete Timeline
2011 AD
Last DPJ Prime Minister Before AbePolitical Action◆ Major
Noda became Prime Minister in September 2011, succeeding Naoto Kan. He was the last leader of the Democratic Party of Japan before Shinzo Abe's return to power in 2012, marking the end of the DPJ's brief period in government.
DPJPrime MinistershipPolitical Transition
Impact: national
2012 AD
Consumption Tax Hike LegislationReform◆ Major
Noda pushed through a controversial bill to raise the consumption tax from 5% to 10% by 2014, despite opposition within his own party. The tax hike was intended to address Japan's massive public debt but cost the DPJ public support.
Tax ReformFiscal PolicyPolitical Risk
Impact: national
Dissolution of the Lower HousePolitical Action◆ Major
Noda dissolved the House of Representatives in November 2012, triggering a snap election. The DPJ suffered a historic defeat, winning only 57 seats, while the LDP under Shinzo Abe returned to power. This ended DPJ rule.
ElectionDPJ DefeatLDP Return
Impact: nationaldestructive
Senkaku Islands NationalizationPolitical Action◆ Major
Noda's government nationalized three of the disputed Senkaku/Diaoyu Islands by purchasing them from a private Japanese owner. This move provoked massive anti-Japan protests in China and severely strained bilateral relations.
Territorial DisputeChina-Japan RelationsNationalization
Impact: regional
This comparison has not been analyzed yet.
One-time AI generation (~1 minute). Scores and timeline are already available below.
Rankings
🥇
Masayoshi OhiraLeader
Mil: 14.6Pol: 59.3Inf: 56.4
49.8
🥈
Yoshihiko Noda
Mil: 16.1Pol: 32.2Inf: 48.6
36.9
+12.9 behind
How This Comparison Works
Algorithm
Each figure is scored on 6 dimensions (0—100 scale) based on structured historical data: Military (10%), Political (20%), Influence (20%), Legacy (20%), Leadership (15%), Strategy (15%). The weighted total produces the final ranking.
Data Sources
Scores are computed from structured sub-indicators in the database. Scale factors adjust for era (Ancient ×0.85, Modern ×1.0) and civilization size (Eastern ×1.05, Other ×0.80) to account for differences in population and military scale.
Maximum 3 Figures
Comparisons are limited to 2—3 figures to ensure readability and statistical meaningfulness.
Error Margins
±5 points per dimension — Sub-scores are derived from historical records with inherent uncertainty. Two figures within 5 points on a dimension should be considered roughly equivalent in that area.
Total Score Accuracy
±3 points overall — The weighted combination of 6 dimensions produces a total score with approximately ±3 points of uncertainty. Differences of less than 3 points are not statistically significant— the figures are effectively tied.
Known Limitations
- Historical records are incomplete and uneven across civilizations
- Figures from oral-tradition societies may be underrepresented
- Occupation labels can misclassify multi-role figures
- Scores measure capability and impact, not moral character
- Quantitative scoring is a comparison tool, not absolute truth
Capability Radar
Military (10%) — Battles & Warfare
Battles
13
13
Win Rate
19
16
Expansion
18
21
Political (20%) — Governance & Reform
Reform
65
20
Diplomacy
70
25
Economy
75
20
Influence (20%) — Cultural & Global Reach
Cultural
30
10
Global
40
10
Legacy (20%) — Historical Impact
Historical
40
15
Longevity
30
10
Leadership (15%) — Power & Stability
Tenure
60
15
Stability
60
15
Strategy (15%) — Tactics & Innovation
Strategy
24
22
Tactics
27
26
Reform
28
32
Similar Comparisons
Comments & Discussion
No comments yet. Be the first to share your thoughts!